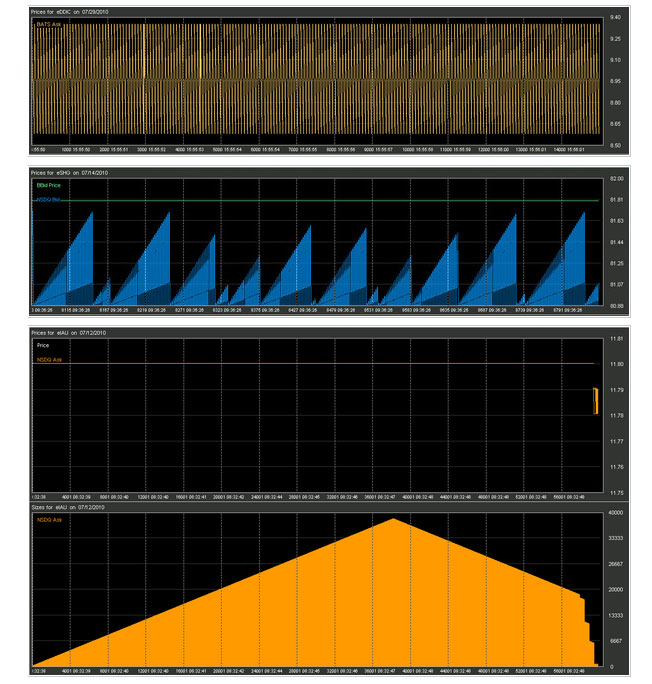
Following the May 6 “flash crash” in which the market plunged 1,000 points in just a few minutes, a data firm started looking at the trades being made by the high-frequency computerized trading bots that have come to loom over over the stock market. By zooming into the trades being placed by the millisecond the firm spotted several strange algorithmic patterns. Plotted on a chart, they look like the freakin’ the stock market equivalent of crop circles. [More]


