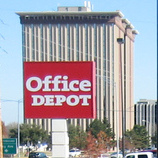
Who needs to lie about inventory when you can inflate the price directly? LAPTOP has uncovered more dirty secrets of Office Depot employees being dishonest to customers, this time by altering price tags on clearance items to incorporate the cost of an extended service plan.
stocks

Recession Best Thing Ever For Non-Graybeards
By 3.17.09
Ever notice how most of the people bitching the hardest about the recession are old people? Here’s an alternative view, and how the economic meltdown might just be the best thing ever if you’re under 35, have a job, and aren’t strapped with debt. [MSN] (Photo: hanapbuhay)


Office Depot Employees Claim They're Told To Lie About Stock If You're Not Buying Extras
By 3.11.09
According to LAPTOP mag, Office Depot has implemented such a stringent sales quota program that the company has essentially broken the in-store laptop buying experience. If you don’t buy accessories and extended service plans, many associates will tell you the laptop is out of stock. Of course, this doesn’t happen at every Office Depot, but LAPTOP writes that they were surprised by the number of similar reports they received of it happening at multiple locations.

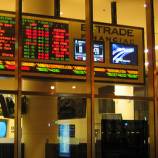
Markets Rally On Bernanke Comments, Citigroup Profits
By 3.10.09
Full Text of Bernake’s Speech [Federal Reserve] (Photo: AGRR 4059)

Stocks: Old Bulls Losing Their Steam
By 3.10.09
Even eternal stock market optimists are losing their nerve these days, but Fidelity’s Peter Lynch still says, “But at some point in the future, I think you’ll look back and see that we’ve gotten through this,” and that “stocks turned out to be the best bet.” Personally, I’ve started to look at it as throwing money down a magic wishing well, or planting magic seeds that will take 10 years to grow (it’s amazing how adding the word “magic” to anything makes it a little more psychologically palatable). [NYT] (Photo: ynskjen)
Single Men Trade Stocks Too Much
By 3.10.09
Nick Kapur at The Motley Fool says that men trade stocks more frequently than women. This is not a good thing; the result of all this hyperactivity and overconfidence is lower earnings on your investment. He writes, “Worse still (for unmarried guys like me) is that single men trade a whopping 67% more than single women, earning them annual net returns of 2.3% less! The authors cite increased trading costs, taxes, and a greater tendency to speculate as reasons for this underperformance.”
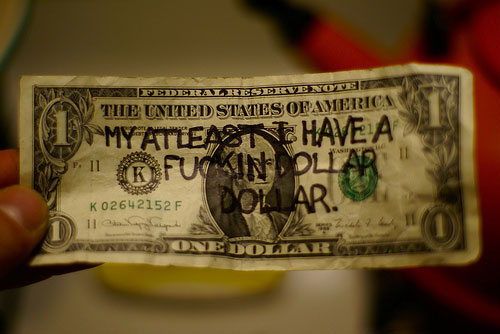
NYSE Thinking About Chucking $1 Rule
By 2.25.09
The New York Stock Exchange is thinking about getting rid of the pesky rule that your company’s stock needs to trade above $1 for it to remain listed. [Yahoo! Finance] (Photo: woodendesigner)

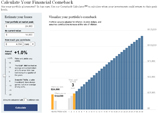
Calculate How Long Till Your Portfolio Recovers
By 2.16.09
How long will it take your portfolio to recover from this financial Armageddon? NYT’s cool calculator tells me it’s going to take about three years. Check it, just punch in how much your portfolio was worth at its peak, its current value, how much you contribute on a regular basis, and play with the annual return. It generates a nice Times-quality graph of how long it’s going to take you to get it all back, and what the outlook is for years to come. Good way of putting the whole shebang in perspective.
By 1.20.09
../../../..//2009/01/20/hope-didnt-save-the-stock/
Hope didn’t save the stock market…”The Dow Jones Industrial Average dropped 332.13 points, or 4%, to 7949.09. The index was hurt by declines in all its financial components. Bank of America fell 29% and J.P. Morgan Chase fell 21%. Citigroup declined 20%.” [WSJ]
94th Richest Man In World Kills Self
By 1.7.09
Adolf Merckle, the 94th richest man in the world, committed suicide this week. Stock speculation is hazardous to your health. [NYT]

Suicide: Hedge Fund Manager Who Invested $1.4 Billion In Madoff Scheme Found Dead
By 12.24.08
A hedge fund manager, Rene-Thierry Magon de la Villehuchet, who invested $1.4 billion in Madoff’s $50billion Ponzi scheme was found dead by apparent, movie-style, suicide.
Jim Cramer's Advice Slightly Worse Than A Coin Toss?
By 12.23.08
In a not-so-shocking analysis of one of the most-watched TV investment advisers, author Eric Tyson argues that Jim Cramer’s actual stock-picking performance doesn’t match the strength of his bellowing.

New Enron Stock Settlement
By 12.16.08
If you bought individual Enron stock, you might get a piece of a new settlement against all the companies who supported Enron along the way and knew, or should have known, what was up. [TopClassActions]

$50 Billion Ponzi Scheme Could Just Be For Starters
By 12.13.08
Madoff’s $50 billion scam came unwound when too many investors tried to pull their money at the same time, which means we’re likely to more big swindles get exposed in the coming months…

$50 Billion Ponzi Scheme Busted
By 12.12.08
Famous broker Bernard Madoff was arrested yesterday for running what was really a $50 billion pyramid scheme. Slate’s The Big Money has insight on how investors can spot an operator like Madoff:
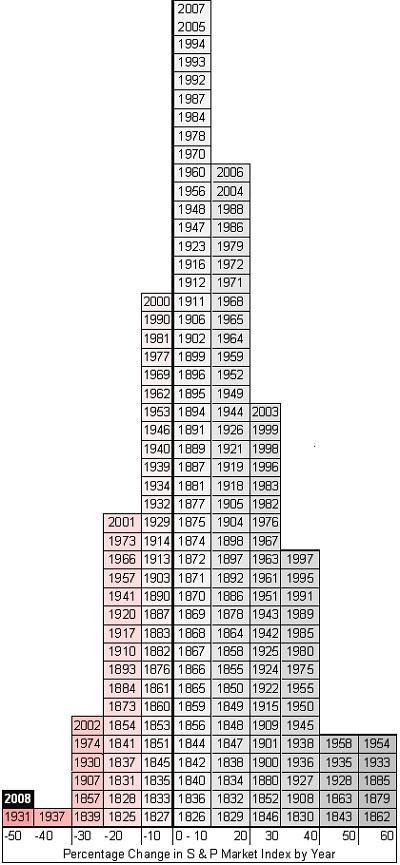
Sexy Graph Demonstrates S&P's Historic Dismalness This Year
By 12.10.08
Here is a sexy graph breaking down the S&P’s performance from 1825 to present, fitting each year into a column based on that year’s annual returns, from -50% to +60%.